
If you have been trying to make sense of Troy’s housing market, you have probably noticed the numbers do not agree with each other. In mid-2026, Redfin pegged the median sale price for the three months ending May at about $436,000, while Realtor.com listed a median listing price of $464,950 for the same window. Both are correct. They simply measure different things, and understanding that gap is the single most useful skill a Troy buyer or seller can have this year. This page pulls the scattered public data into one place so you can see the whole market at a glance — and know which number actually applies to your situation.
Shaylah Gaines, Realtor with Keller Williams Somerset — serving Troy, Birmingham, and the surrounding Oakland, Macomb, and Wayne County communities. Call (313) 689-3505.
Troy Housing Market at a Glance (2026)
- Median sale price hovers in the low-to-mid $400Ks — roughly $434,000 in late-2025 Redfin data, with mid-2026 three-month figures near $436,000. (Redfin, 2025–2026)
- Year-over-year price change runs positive but modest — Redfin showed December 2025 up 8.4% year over year; Zillow’s home-value index was essentially flat at -0.2%. (Redfin / Zillow, 2026)
- Homes sell fast — median days on market ran roughly 19 to 41 days across sources in early-to-mid 2026, versus a national median of about 33. (Movoto / Houzeo / Redfin, 2026)
- Sellers keep almost all of their asking price — Troy’s sale-to-list ratio sat near 98%, and metro-wide sellers averaged 99.7% of list. (Houzeo / Realcomp MLS, 2026)
- Inventory is tight but loosening — Troy held roughly 2.1 months of supply in early 2026, well under the 4–6 months of a balanced market. (Houzeo, 2026)
- Price cuts are climbing — the share of Troy homes with a price reduction rose to about 19.7% in January 2026 from effectively zero a year earlier. (Houzeo, 2026)
- The typical Troy home value is about $415,000, per Zillow’s index — a useful “steady-state” number that smooths out monthly swings. (Zillow, 2026)
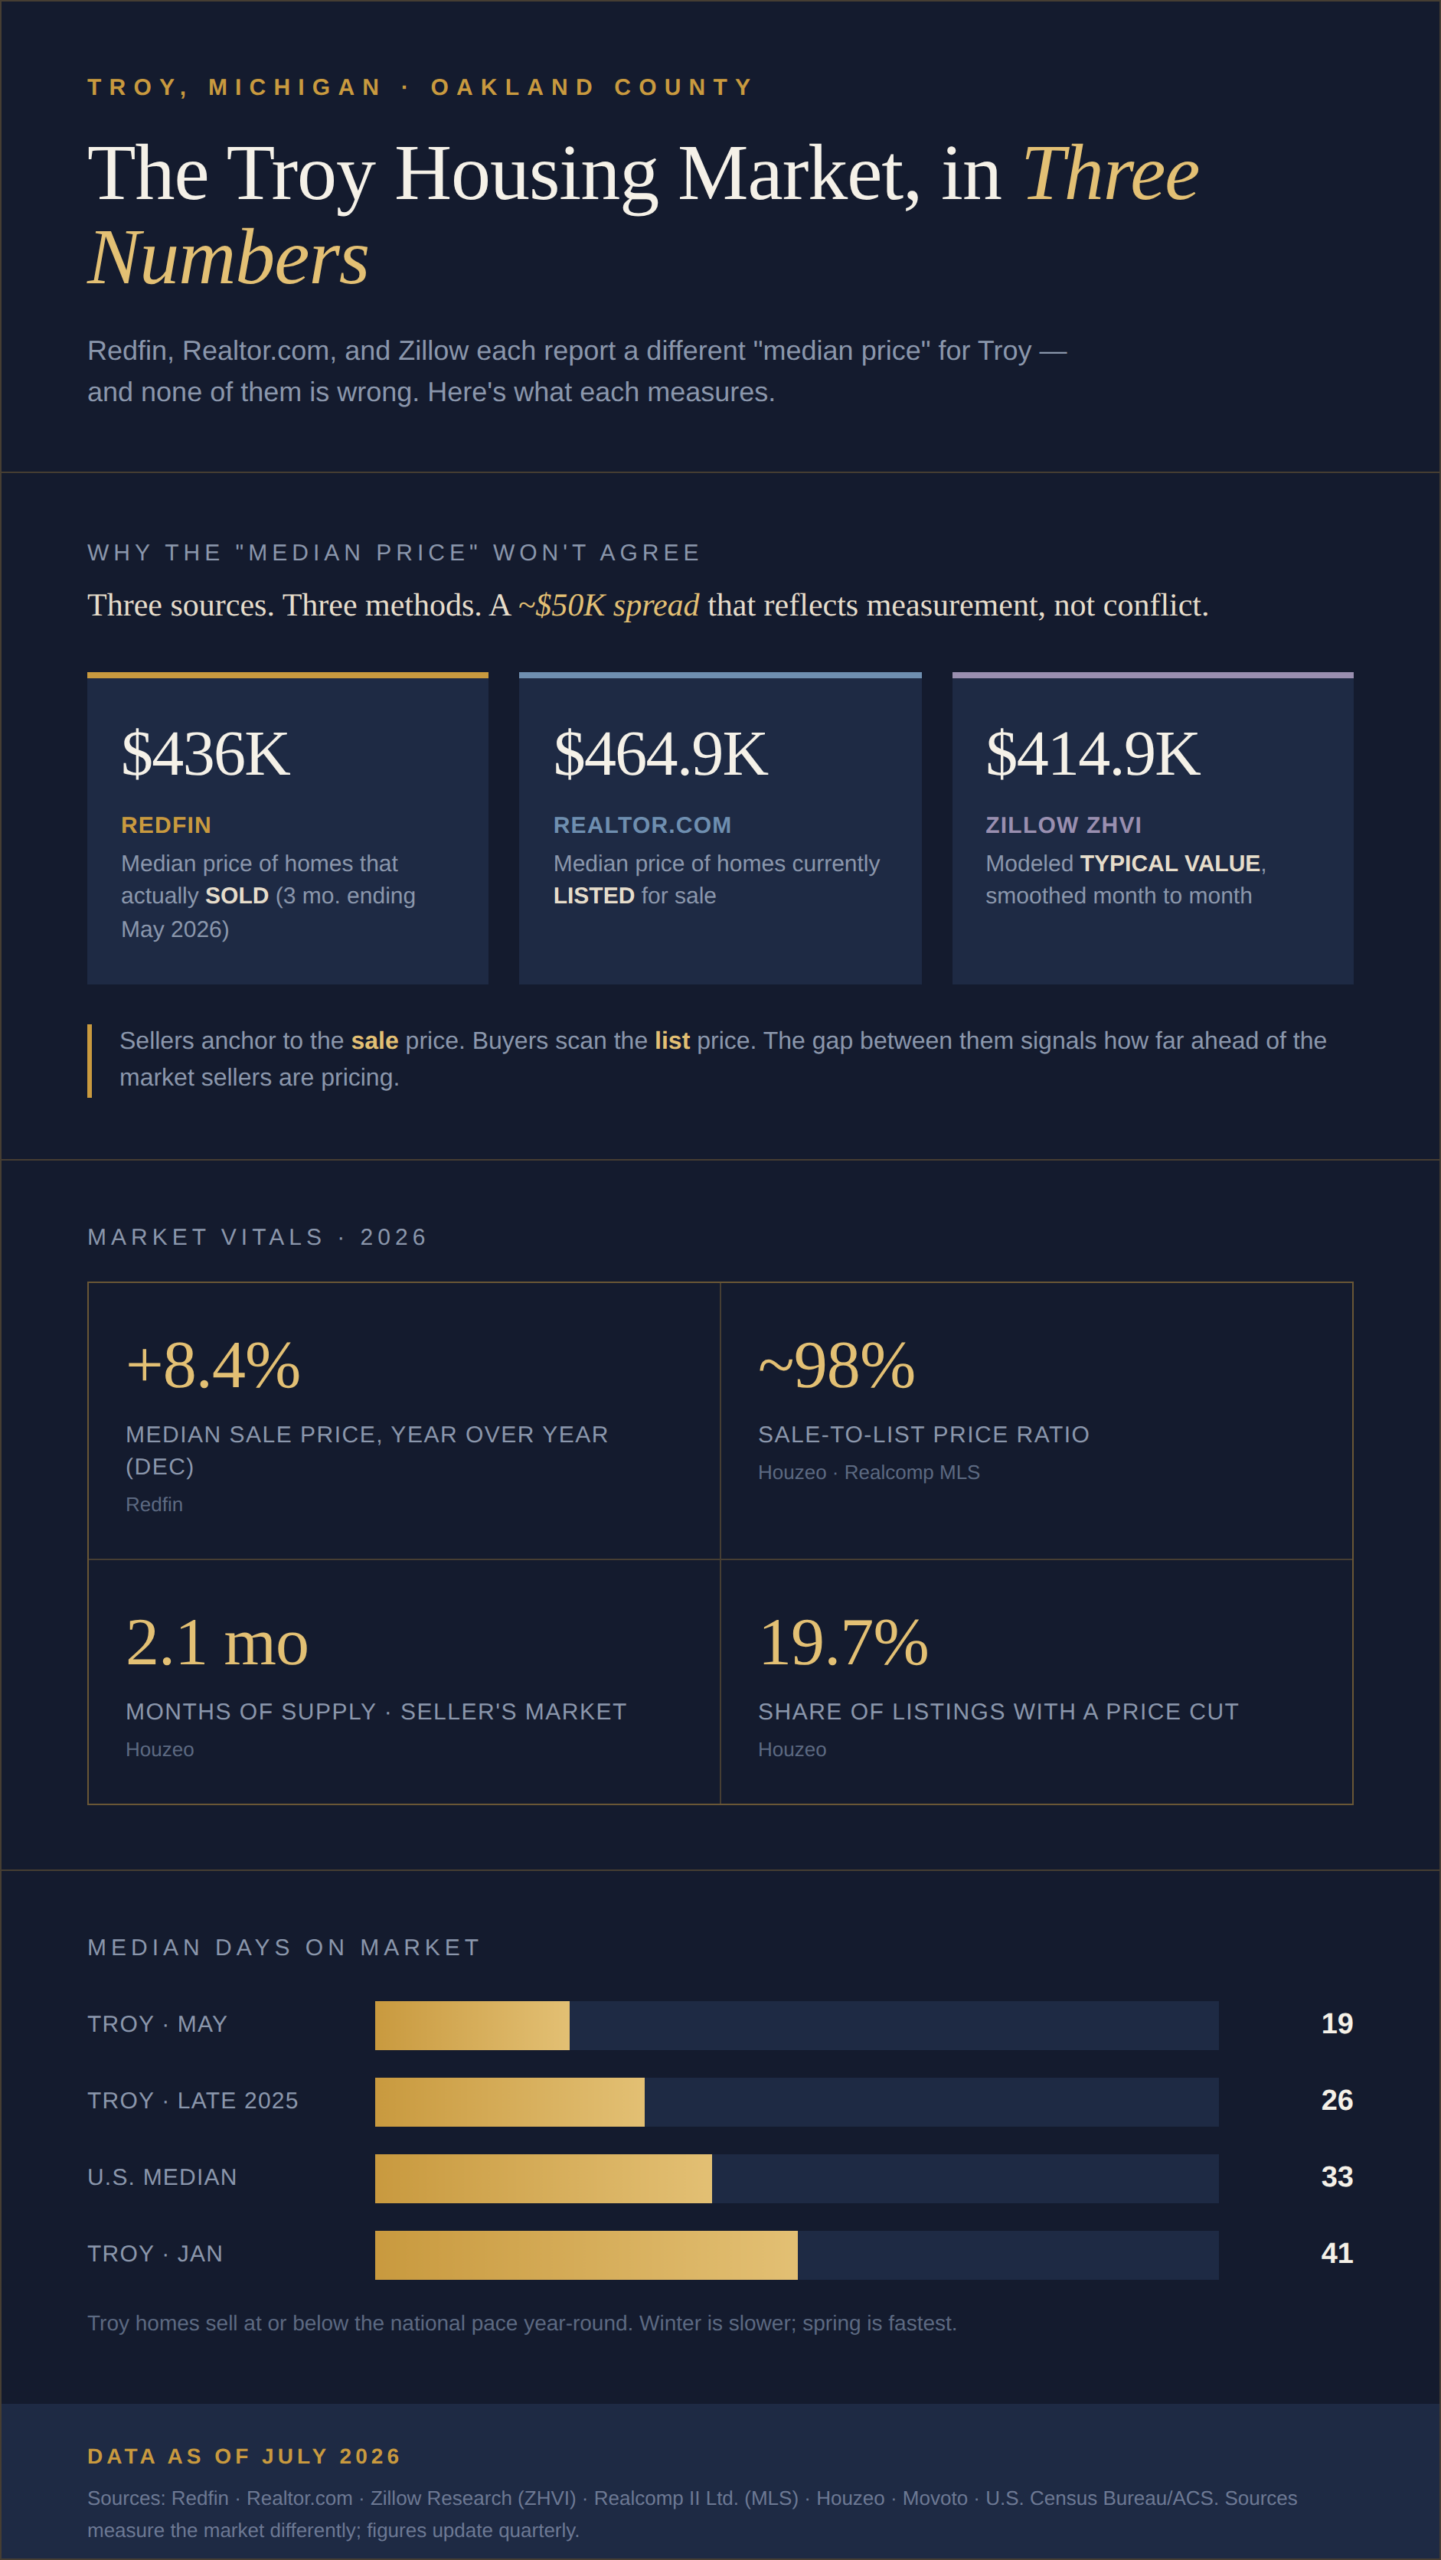
Prices: Which Number Is Right?
Here is the core confusion, stated plainly. Redfin’s roughly $436,000 is a median sale price — the middle value of homes that actually closed. Realtor.com’s $464,950 is a median list price — the middle value of homes currently for sale. List prices skew higher because they include aspirational pricing and homes that have not sold yet; sale prices reflect what buyers were truly willing to pay. Zillow adds a third lens with its Zillow Home Value Index of about $414,936, a modeled “typical value” designed to stay stable month to month rather than bounce with whichever homes happened to close.
None of these are wrong. They answer different questions. If you are a seller wondering what you will net, the median sale price is your anchor. If you are a buyer scanning what is available today, the median list price tells you what the competition is asking. The spread between them — here, close to $29,000 — is itself a signal: a wide gap suggests sellers are pricing ahead of the market, which shows up later as price cuts.
Source: Redfin (three months ending May 2026); Realtor.com listing data (2026); Zillow Home Value Index (2026).
Not sure which number applies to your home? A quick comparative market analysis cuts through the noise. Call Shaylah Gaines at (313) 689-3505 for a no-cost read on your specific street.
Year-Over-Year: A Market That Is Firming, Not Spiking
Direction matters more than any single month. Redfin reported Troy’s December 2025 median sale price up 8.4% year over year, and its metro-Detroit reporting showed Troy closed prices up 6.4% alongside a 2.7% rise in the Zillow value index through mid-2026 — the kind of agreement between two different measurements that signals real, durable appreciation rather than a statistical blip.
At the same time, Zillow’s standalone index for the city read -0.2% over the trailing year, and one aggregator showed a monthly median down a fraction of a percent. This is normal. Single-month medians swing hard in a city where only 50 to 90 homes close in a given month — one cluster of luxury sales in Downtown Troy (where the three-month median hit $515,000) can drag the citywide number up or down regardless of what is happening to typical homes.
The local reframe: Statewide, Michigan’s median sale price rose 5.4% year over year to about $293,956. Troy sits well above that — its price level is roughly 1.5x the state median — but its growth rate is broadly in line with Michigan overall. Troy’s premium comes from its schools and its proximity to Detroit-area employment, not from runaway appreciation.
Source: Redfin (2025–2026); Zillow Research (2026); Realcomp MLS via metro-Detroit reporting (June 2026).
Days on Market & Sale-to-List: How Fast, and For How Much
Troy homes move quickly. Depending on the source and month, median days on market ranged from about 19 days (Movoto, May 2026) to 41 days (Houzeo, January 2026), with Redfin’s late-2025 figure around 26 days. Seasonality explains much of the spread — winter is slower, spring is faster — but even the high end sits at or below the national median of roughly 33 days.
Speed pairs with pricing power. Troy’s sale-to-list ratio held near 98% in early 2026, and across the broader metro, well-priced homes closed at 99.7% of asking. In practical terms: sellers of clean, correctly priced homes in Troy, Royal Oak, or Sterling Heights were still fielding multiple offers within about two weeks in mid-2026. Roughly three of every ten homes listed metro-wide in June went pending within the same month.
The catch for sellers: that 98% ratio applies to homes priced right. The rising share of price reductions — up to nearly 20% of Troy listings — is the market’s way of correcting sellers who aimed too high out of the gate.
Source: Movoto, Houzeo, Redfin (2026); Realcomp MLS (June 2026).
Inventory & Supply: Still a Seller’s Market, But Easing
Troy remains supply-constrained. The city carried roughly 2.1 months of supply in early 2026 — anything under six months is considered seller territory. For a city of about 87,000 residents, active listings often dipped below 200 at any given time, a structural shortage that has propped up prices for years.
But the pressure is easing. Metro-Detroit inventory reached a five-year high in mid-2026, with 25,885 active MLS listings, up 12.6% year over year, and Michigan statewide listings up 8.4%. More choice for buyers, without a flood, is the healthiest kind of loosening — it takes the frenzy out without triggering a price collapse.
The local reframe: Even at a five-year inventory high, metro Detroit’s 2.9 months of supply is still far below the 4–6 months that defines a balanced market. Troy, with its schools and location premium, sits at the tighter end of that range. Buyers here get slightly more room to breathe in 2026 than in 2024, but not enough to expect deep discounts.
Source: Houzeo (2026); Realcomp MLS / Redfin county data (June 2026).
The Rate & Affordability Backdrop
None of Troy’s local numbers exist in a vacuum — mortgage rates set the ceiling on what buyers can bid. As of late July 2026, the 30-year fixed averaged 6.58% per Freddie Mac, down modestly from 6.74% a year earlier. Rates have traded in a narrow band since mid-May, giving buyers a rare stretch of predictability.
That stability, combined with rising inventory and wage growth, is why forecasters describe affordability as modestly improving even as prices hold firm. Realtor.com’s midyear update trimmed its 2026 national price-growth forecast to about 1.2% — slower than inflation, meaning prices are roughly flat in real terms.
Source: Freddie Mac Primary Mortgage Market Survey (July 2026); Realtor.com 2026 forecast (midyear update).
The Local Context Behind the Numbers
Troy’s fundamentals explain why the market stays tight even as rates sit in the mid-6s. Per Census/ACS data, the city’s homeownership rate is about 73.3% — well above the national 65.2% — meaning most Troy homeowners are long-term residents who stay put, which naturally starves the resale market of inventory. The median property value reached $420,300 in 2024, up 5.92% from the prior year, and roughly 1.26x the national median of $332,700.
The housing stock skews toward established single-family homes: detached houses make up about 71% of Troy’s units, with condos and townhomes filling much of the rest. That mix is why entry-level buyers cluster in the condo segment while the classic Troy colonials and ranches in the $400K–$550K range remain the most competitive slice of the market.
Source: U.S. Census Bureau / American Community Survey (2024); NeighborhoodScout (2024–2025).
Thinking about buying or selling in Troy this year? The market rewards preparation. Book a free consultation with Shaylah Gaines at (313) 689-3505 and shop — or list — with real numbers.
Troy, MI Real Estate Statistics Summary Table (2026)
| Statistic | Figure | Source | Year |
|---|---|---|---|
| Median sale price (3 mo. ending May) | ~$436,000 | Redfin | 2026 |
| Median list price | $464,950 | Realtor.com | 2026 |
| Zillow Home Value Index (typical value) | $414,936 | Zillow | 2026 |
| Median sale price, Dec 2025 | $433,750 | Redfin | 2025 |
| Year-over-year price change (Dec) | +8.4% | Redfin | 2025 |
| Year-over-year value change (ZHVI) | -0.2% | Zillow | 2026 |
| Troy closed-price change (metro report) | +6.4% | Realcomp MLS | 2026 |
| Downtown Troy median (3 mo.) | $515,000 | Redfin | 2026 |
| Median days on market (May) | ~19 days | Movoto | 2026 |
| Median days on market (Jan) | ~41 days | Houzeo | 2026 |
| Median days on market (late 2025) | ~26 days | Redfin | 2025 |
| Sale-to-list ratio (Troy) | ~98% | Houzeo | 2026 |
| Sale-to-list ratio (metro avg) | 99.7% | Realcomp MLS | 2026 |
| Share of homes with price reductions | ~19.7% | Houzeo | 2026 |
| Months of supply (Troy) | ~2.1 | Houzeo | 2026 |
| Months of supply (metro) | 2.9 | Realcomp MLS | 2026 |
| Active listings (metro Detroit) | 25,885 (+12.6% YoY) | Realcomp MLS | 2026 |
| Homes sold, Troy (May) | 259 | Movoto | 2026 |
| Michigan median sale price | $293,956 (+5.4%) | Redfin | 2026 |
| 30-year fixed mortgage rate | 6.58% | Freddie Mac | 2026 |
| 30-year rate, one year prior | 6.74% | Freddie Mac | 2025 |
| Homeownership rate (Troy) | 73.3% | Census/ACS | 2024 |
| Median property value (Troy) | $420,300 (+5.92%) | Census/ACS | 2024 |
| Detached single-family share | ~71% | NeighborhoodScout | 2024 |
| Median price per square foot | ~$192–$221 | Movoto / RE/MAX | 2026 |
Frequently Asked Questions
What is the average home price in Troy, MI in 2026? It depends on which measure you use. The median sale price in Troy sat around $436,000 for the three months ending May 2026 (Redfin), while the median list price was $464,950 (Realtor.com) and Zillow’s typical home value read about $414,936. Sale price reflects closed deals; list price reflects what is currently for sale.
Is Troy, MI a buyer’s or seller’s market in 2026? Troy is still a seller’s market, but a loosening one. With roughly 2.1 months of supply and a sale-to-list ratio near 98%, sellers of well-priced homes hold the advantage — yet rising metro inventory (a five-year high) is giving buyers modestly more choice than in prior years.
How fast do homes sell in Troy, MI? Fast. Median days on market ranged from about 19 days in spring 2026 to roughly 41 days in the slower winter window, with a late-2025 figure near 26 days — at or below the national median of about 33 days.
Are home prices going up or down in Troy, MI? Mostly firming, not spiking. Redfin showed December 2025 prices up 8.4% year over year and metro reporting put Troy closed prices up 6.4%, while Zillow’s smoother index was roughly flat. Single-month swings are large because relatively few homes close each month.
Why do Redfin, Zillow, and Realtor.com report different Troy prices? Because they measure different things. Redfin reports the median price of homes that sold; Realtor.com reports the median price of homes listed for sale; Zillow reports a modeled typical value built to stay stable month to month. Comparing them side by side gives a fuller picture than any one alone.
Methodology & Sources
Author: Shaylah Gaines, Realtor, Keller Williams Somerset — Troy, MI. Figures below reflect the most recent public data available as of July 2026. Where sources measure the market differently, the difference is noted in the text rather than reconciled into a single number.
- Redfin — Median sale prices, days on market, and sale-to-list ratios for Troy and Michigan, calculated from MLS and public records.
- Realtor.com — Median list price for active Troy inventory.
- Zillow Research (ZHVI) — Modeled “typical home value” designed to smooth monthly volatility.
- Realcomp II Ltd. (MLS) — Metro-Detroit and county-level closed-sale, inventory, and sale-to-list data.
- U.S. Census Bureau / American Community Survey — Homeownership rate, median property value, and housing-stock composition for Troy.
- Freddie Mac Primary Mortgage Market Survey (PMMS) — Weekly national 30-year and 15-year fixed mortgage rate averages.
- Houzeo & Movoto — Supplemental monthly Troy market snapshots (median price, supply, price-reduction share, days on market).
- NeighborhoodScout — Housing-type composition and long-run value data.
Buying or Selling in Troy? Start With the Right Number.
The Troy market rewards people who understand what they are looking at. A median list price will not tell a seller what they will net, and a smoothed value index will not tell a buyer what to offer this weekend. Matching the right statistic to your real situation — and to the specific neighborhood and price band you care about — is exactly where a local agent earns their keep.
Call Shaylah Gaines at (313) 689-3505 for a free, no-pressure market analysis of your Troy home or your target neighborhood. Let’s turn these numbers into a plan.